Bottom line: when the first two 60-minute ES RTH bars (09:30–11:30) both close up, the day closes up 84.5% of the time; when both close down, the day closes down 79.9% of the time. This kind of open happens about every other day.
But most of that high win rate is already “spent”: buying at the close of the second bar (11:30), you’re still ahead at the close only 56.3% of the time, about the same as buying on any random day.
How I use it: after two bull hours at the open, the two numbers that matter more are these: the low of the day is already in 77.5% of the time, and price makes a new high later 82.0% of the time. That favors buying a pullback with a stop below the day’s low, rather than chasing at 11:30.
When I traded breakouts, I used to see a string of bull bars at the open and couldn’t wait to get in. I’d buy almost in a panic, completely gripped by FOMO. And then, more often than not, I’d find I had bought the top.
Al Brooks often says that in a strong trend you can buy the close. So does a string of bull bars at the open count as that kind of trend? When is it buying the close with the trend, and when is it just chasing?
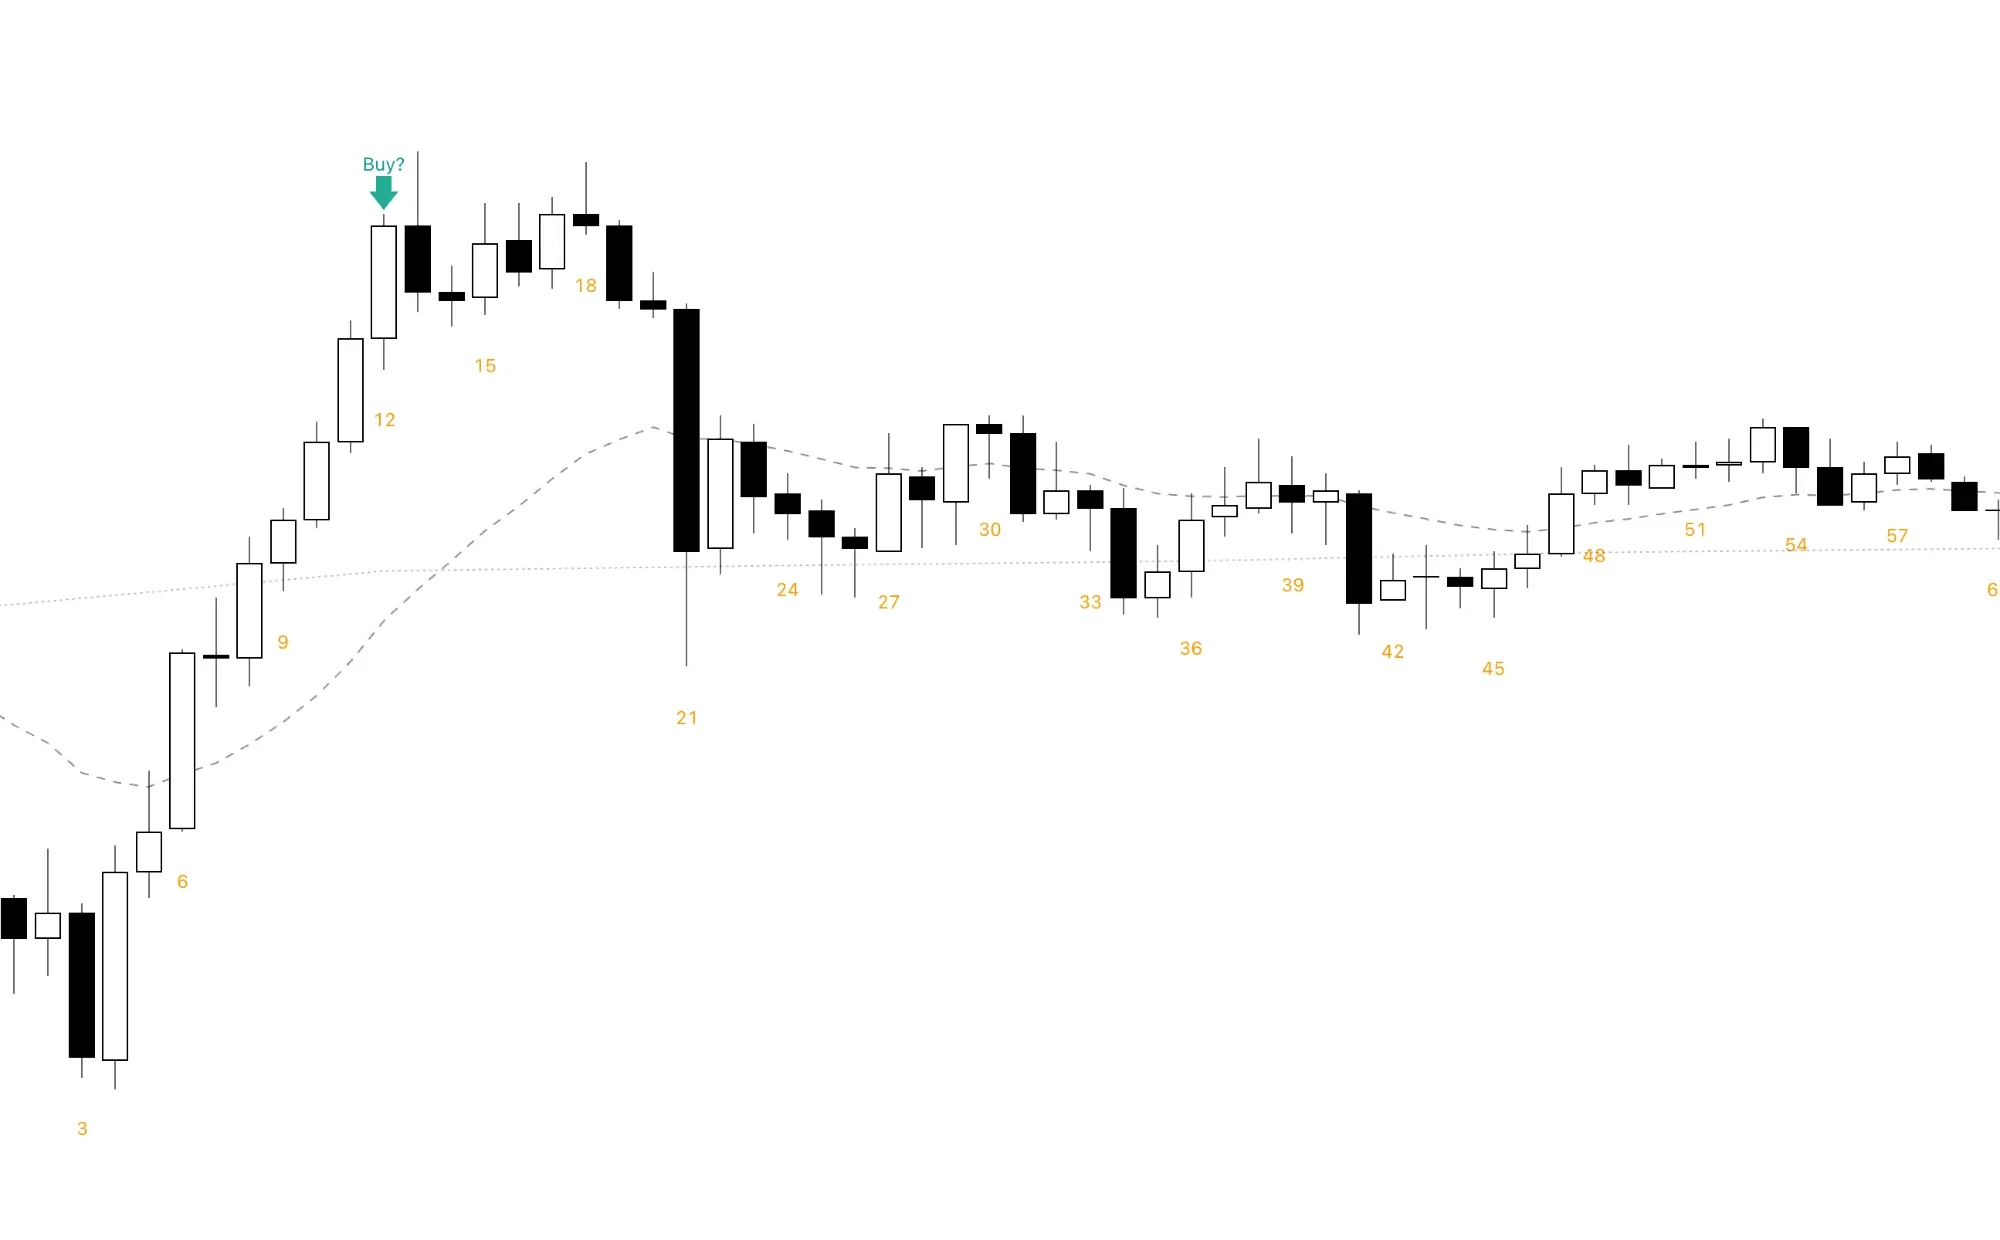
5-minute chart, 2026-10-21. From bar 4 on, almost every bar closed up, and the first 60-minute bar closed strong. Buying at the close of bar 12 (10:30, which is also the close of the first 60-minute bar) meant buying near the high of the day: after a few sideways bars, bar 21, a big bear bar, dropped straight back below the moving average, and price never got back to the entry that day.
To answer that question, I used ES data from 2010 to 2026 to see how the day closes after consecutive same-color bars at the open. I focused on the 60-minute chart, and also looked at how many same-color bars in a row appear at the open on the 5, 15 and 30-minute charts.
2010–2026 · first 2 60-minute bars both bull, the day closes up
84.5%
Happens on 1,062 days (27.1%) · but the close is above bar 2's close only 56.3%
After the first N bars are all the same colorX axis: how many opening bars in a row. Points with fewer than 20 days are hollow; dashed line: the rate across all days.
Bull bar = close > open, bear bar = close < open. Day closes up = RTH close > RTH open. Signal close = close of bar N, the earliest price you could enter at after seeing the signal. Low of day already in = the day's low is inside the first N bars. New high later = some bar after bar N trades above the first N bars' high. Hover (or tap) the chart to see the numbers.
First two 60-minute bars both bull: the day closes up 84.5% of the time
| First two 60-minute bars | Both bull | Both bear |
|---|---|---|
| How often | 1,062 days (27.1%) | 874 days (22.3%) |
| Day closes the same color | 84.5% | 79.9% |
| Close beyond bar 2’s close | 56.3% | 45.7% |
| Opposite extreme already in | 77.5% | 74.9% |
| New high (low) later | 82.0% | 75.1% |
- It’s common: the two cases together make up 49.4% of days, so about every other day the first two hours are the same color.
- The day closes the same color most of the time: 84.5% for bull, 79.9% for bear.
- Bear is a little weaker than bull: every number is a few points lower for bear bars, which fits ES’s overall upward drift over these 16 years.
Why buying then pays off only 56% of the time
“The day closes up” compares the close with the open. By 11:30 the two bull bars are already done, the day is probably up a fair amount already, and it counts as an up day as long as the close doesn’t fall back below the open. So most of that 84.5% has already happened.
The question you can actually trade is: if you enter at 11:30 after seeing the signal, can you still make money from there to the close?
- After two bull bars, the close is above the second bar’s close only 56.3% of the time. Across all days, 54.6% close up, so that’s about the same.
- After two bear bars it’s even clearer: the close is below the second bar’s close only 45.7% of the time, less than half. In other words, on days when the first two hours both go down, the rest of the day more often claws some of it back.
So two same-color hours at the open tell you “which side the day will probably close on”, not “how much is left to make if you get in now”.
Two more useful numbers
After two bull hours at the open:
- The low of the day is already in: 77.5%. With a long stop below the day’s low, you won’t get hit by a “new low of the day” on roughly eight days out of ten.
- A new high later: 82.0%. On about eight days out of ten, price trades above the morning high after 11:30, so the morning high is a level to watch, not the top.
The matching numbers for two bear bars are 74.9% and 75.1%, a little weaker than for bull bars.
Six bull hours in a row: no big selloff into the close
On the 60-minute chart, you’ll see that “new high later” drops from 84.4% at bar 5 to 66.7% at bar 6. It looks as if everyone is dumping their longs into the close, but the data says otherwise:
- 87 days opened with six bull 60-minute bars in a row. Bar 6 closes at 15:30, leaving only the last 45 minutes.
- On those 87 days, the close was above the 15:30 close 55.2% of the time, and only 3 days fell more than 0.3% into the close. The close was typically just 11% of the day’s range below the high, essentially near the high.
- So “new high later” drops mainly because there’s too little time left to make another new high. Profit-taking into the close mostly shows up as price stalling near the high, not as a long slide.
Shorter bars
On the 5, 15 and 30-minute charts, consecutive same-color bars at the open are a much weaker signal:
| First N bars all bull | Day closes up |
|---|---|
| 5 minutes × 2 bars (to 9:40) | 67.1% |
| 15 minutes × 2 bars (to 10:00) | 72.9% |
| 30 minutes × 2 bars (to 10:30) | 78.1% |
| 60 minutes × 2 bars (to 11:30) | 84.5% |
| 60 minutes × 3 bars (to 12:30) | 93.6% |
The pattern is simple: the more time the signal uses up, the higher “the day closes up” goes, but the less time and room are left for you. And “close above the signal close”, for bull combinations with more than 100 days, stays between 51% and 61%; none of them clearly beats “buying on any random day”.
Definition and how to reproduce it
Consecutive same-color bars at the open
- Data: cleaned 1-minute ES bars, 2010-06 to 2026-09, 3,924 trading days. See how I cleaned it.
- RTH: 09:30–16:15 US Eastern. The 5, 15, 30 and 60-minute bars all start at 09:30, and a short last bar still counts (the last 60-minute bar is 15:30–16:15).
- Bull / bear bars: close > open is a bull bar, close < open is a bear bar; equal counts as neither.
- Signal: the first N bars of the day are all bull bars (or all bear bars).
- The day closes up: RTH close > RTH open, i.e. the daily bar is a bull bar.
- Close above the signal close: RTH close > bar N’s close.
- Low of the day already in: the day’s RTH low is inside the first N bars.
- New high later: after bar N, some bar’s high is above the highest high of the first N bars.
I have a CSV of cleaned 1-minute ES futures bars (Databento's ES.c.0 continuous contract, with columns ts_event, open, high, low, close; timestamps in UTC). Please write Python code that measures what happens on days when the first N RTH bars are all bull bars (or all bear bars). Rules:
1. Convert timestamps to US Eastern time (US/Eastern), handling daylight saving time automatically. Use RTH only, 09:30–16:15, meaning 1-minute bars from 09:30 to 16:14.
2. Build 5, 15, 30 and 60-minute bars from the 1-minute bars, starting at 09:30; a short last bar still counts (for example, the last 60-minute bar is 15:30–16:15). Each bar's open is its first minute's open and its close is its last minute's close.
3. Bull bar: close > open; bear bar: close < open; equal counts as neither.
4. Signal: the first N bars of the day are all bull bars (or all bear bars), with N = 1 to 8 for 5 and 15-minute bars and N = 1 to 6 for 30 and 60-minute bars.
5. For each signal, measure four things (shown for bull bars; reverse everything for bear bars):
   - The day closes up: RTH close > RTH open;
   - Close above the signal close: RTH close > bar N's close, i.e. buying at bar N's close would be profitable at the close;
   - The low of the day is already in: the day's RTH low is inside the first N bars;
   - New high later: after bar N, some bar's high is above the highest high of the first N bars.
6. Print the share of all days closing up and down; then for each bar size, each N, and bull and bear separately, print the number of signal days, their share of all days, and the four shares above.
7. Finally, look separately at days when the first 6 sixty-minute bars are all bull bars: bar 6 closes at 15:30. Print the number of such days, the share closing above the 15:30 close, the number of days falling more than 0.3% from 15:30 to the close, and the median distance from the close to the day's high as a share of the day's range.
Please add comments to every step explaining why it's done that way.
# Consecutive same-color bars at the open: when the first N RTH bars are all bull (bear) bars, how does the day close?
# Input: cleaned 1-minute ES bars (Databento ES.c.0, timestamps in UTC)
import numpy as np
import pandas as pd

df = pd.read_csv("ES-1min_clean.csv", usecols=["ts_event", "open", "high", "low", "close"])
t = pd.to_datetime(df.ts_event, utc=True).dt.tz_convert("US/Eastern").dt.tz_localize(None)
m = t.dt.hour * 60 + t.dt.minute - 570                      # minutes since 09:30
rth = df[(m >= 0) & (m < 405)].assign(date=t.dt.normalize(), m=m)   # RTH 09:30–16:15

day = rth.groupby("date").agg(o=("open", "first"), h=("high", "max"), l=("low", "min"), c=("close", "last"))
print(f"Sample {len(day)} days, closed up {100 * (day.c > day.o).mean():.1f}%, closed down {100 * (day.c < day.o).mean():.1f}%")

for T in [5, 15, 30, 60]:                                   # bar size (a short last bar still counts, e.g. 15:30–16:15 on the 60-minute chart)
    k = rth.assign(k=rth.m // T).groupby(["date", "k"])
    bars = k.agg(o=("open", "first"), h=("high", "max"), l=("low", "min"), c=("close", "last"))
    color = np.sign(bars.c - bars.o).unstack()              # one row per day: is bar 1, 2, 3, … bull (+1) or bear (−1)
    hi = bars.h.unstack().cummax(axis=1)                    # highest high up to bar N
    lo = bars.l.unstack().cummin(axis=1)
    close = bars.c.unstack()
    for N in range(1, (8 if T <= 15 else 6) + 1):            # same as the interactive chart: up to bar 8 for 5 and 15 minutes, bar 6 for 30 and 60
        for s, name in [(1, "bull"), (-1, "bear")]:
            sig = (color.iloc[:, :N] == s).all(axis=1)      # the first N bars are all bull (bear) bars
            d = day[sig]
            sig_close = close.iloc[:, N - 1][sig]           # signal close = the close of bar N
            hiN, loN = hi.iloc[:, N - 1][sig], lo.iloc[:, N - 1][sig]
            if s > 0:
                same = d.c > d.o                             # the day closes up
                beyond = d.c > sig_close                     # closes above the signal close: buying at bar N's close would be profitable at the close
                opp = loN == d.l                             # the low of the day is already inside the first N bars
                more = d.h > hiN                             # price makes a new high later
            else:
                same, beyond, opp, more = d.c < d.o, d.c < sig_close, hiN == d.h, d.l < loN
            print(f"{T:2d} min, first {N} bar{'s' if N > 1 else ''} all {name}: {sig.sum():4d} days ({100 * sig.mean():.1f}%)"
                  f"  day same color {100 * same.mean():.1f}%  close beyond signal close {100 * beyond.mean():.1f}%"
                  f"  opposite extreme already in {100 * opp.mean():.1f}%  new {'high' if s > 0 else 'low'} later {100 * more.mean():.1f}%")

# First 6 sixty-minute bars all bull: after bar 6 closes at 15:30, what happens in the last 45 minutes
k = rth.assign(k=rth.m // 60).groupby(["date", "k"])
h60 = k.agg(o=("open", "first"), c=("close", "last"))
color, close = np.sign(h60.c - h60.o).unstack(), h60.c.unstack()
six = (color.iloc[:, :6] == 1).all(axis=1)
d, c6 = day[six], close.iloc[:, 5][six]
tail = (d.c - c6) / c6 * 100                                # change from 15:30 to the close, in %
print(f"\nFirst 6 sixty-minute bars all bull: {six.sum()} days; closed above 15:30 {100 * (tail > 0).mean():.1f}%, "
      f"fell more than 0.3% into the close on {(tail < -0.3).sum()} days; median distance from the close to the day's high {100 * ((d.h - d.c) / (d.h - d.l)).median():.0f}% of the day's range")
Limitations
- It only looks at the close, not the path: “close above the signal close” doesn’t mean price didn’t drop a lot first; stops and targets need a separate study.
- Bar size and shape aren’t separated: two big bull bars and two small ones may mean different things; whether bar 2 is an inside bar, or where it closes, isn’t split out here.
- The opening location isn’t considered: for example, two bull bars after a gap up may mean something different from two bull bars after a gap down.